1. 이번 실습의 목적
ROS 2에서 노드를 개발하다 보면 단순히 코드가 실행되는지만 보는 것으로는 부족합니다.
노드가 어떤 토픽을 발행하는지, 어떤 노드와 연결되어 있는지, 내부 상태가 어떻게 변하는지 확인해야 합니다.
이번 글에서는 ROS 2에서 자주 사용하는 디버깅 도구인 다음 항목을 다룹니다.
1. 로그 출력
2. rqt_console
3. rqt_graph
4. rqt_plot
5. Action Server 로그 확인
실습 환경은 turtlesim, 사용자 정의 액션 서버, 그리고 rqt 도구를 기준으로 구성합니다.
2. rqt 관련 패키지 설치
먼저 rqt 관련 패키지를 설치합니다.
sudo apt install ros-humble-rqt*

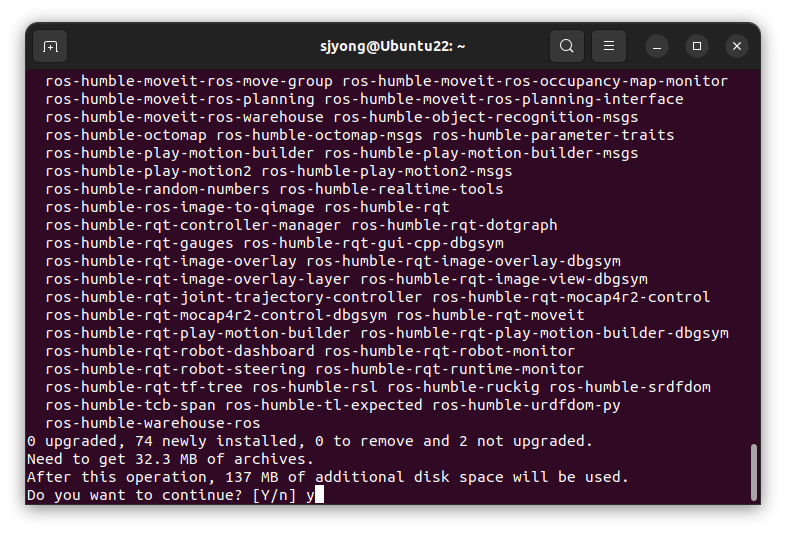
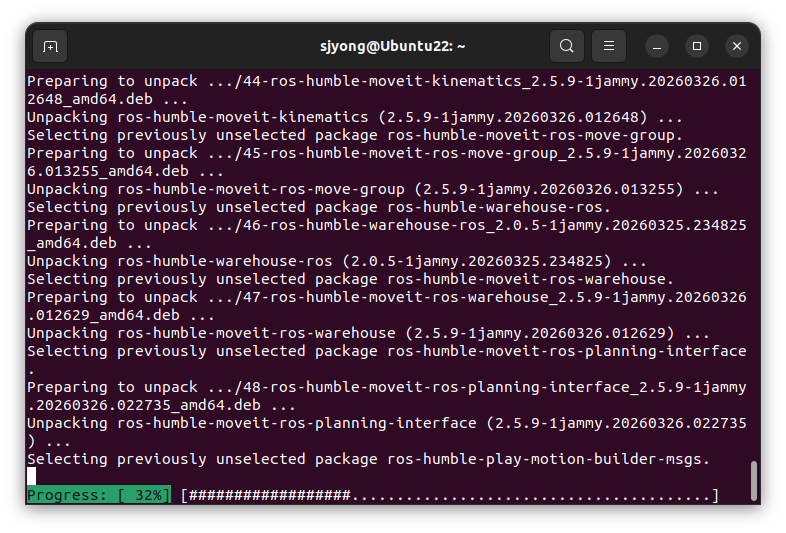
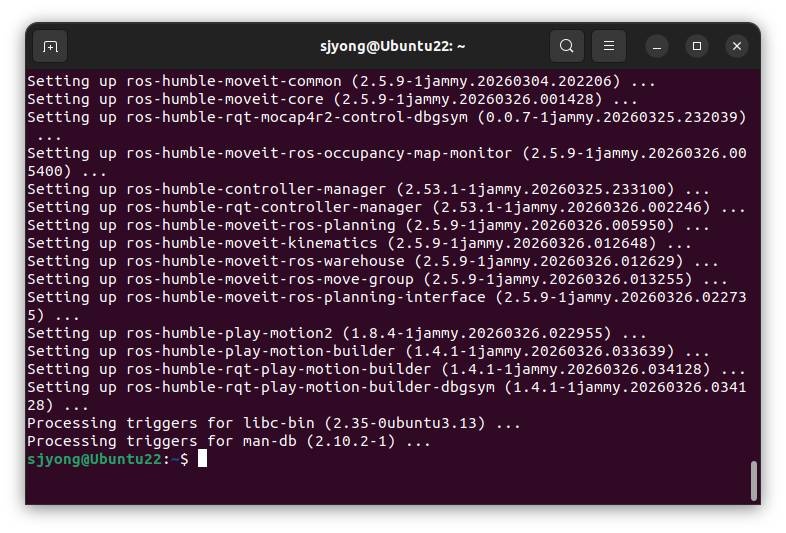
아래와 같이 필요한 패키지만 설치할 수 있습니다.
sudo apt install ros-humble-rqt ros-humble-rqt-graph ros-humble-rqt-console ros-humble-rqt-plot
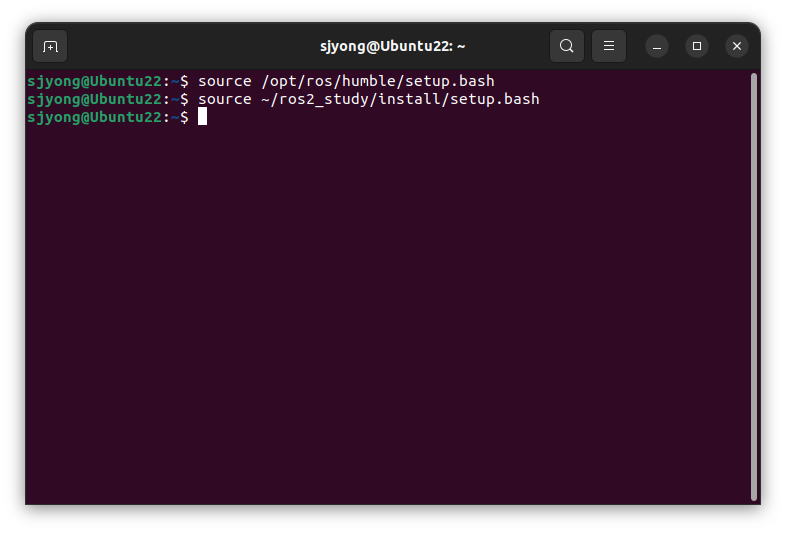
설치 후에는 ROS 2 환경을 다시 불러옵니다.
source /opt/ros/humble/setup.bash
source ~/ros2_study/install/setup.bash
3. rqt의 console에서 로그 확인
터미널을 여러 개 열고 각각 다음 명령을 실행합니다.
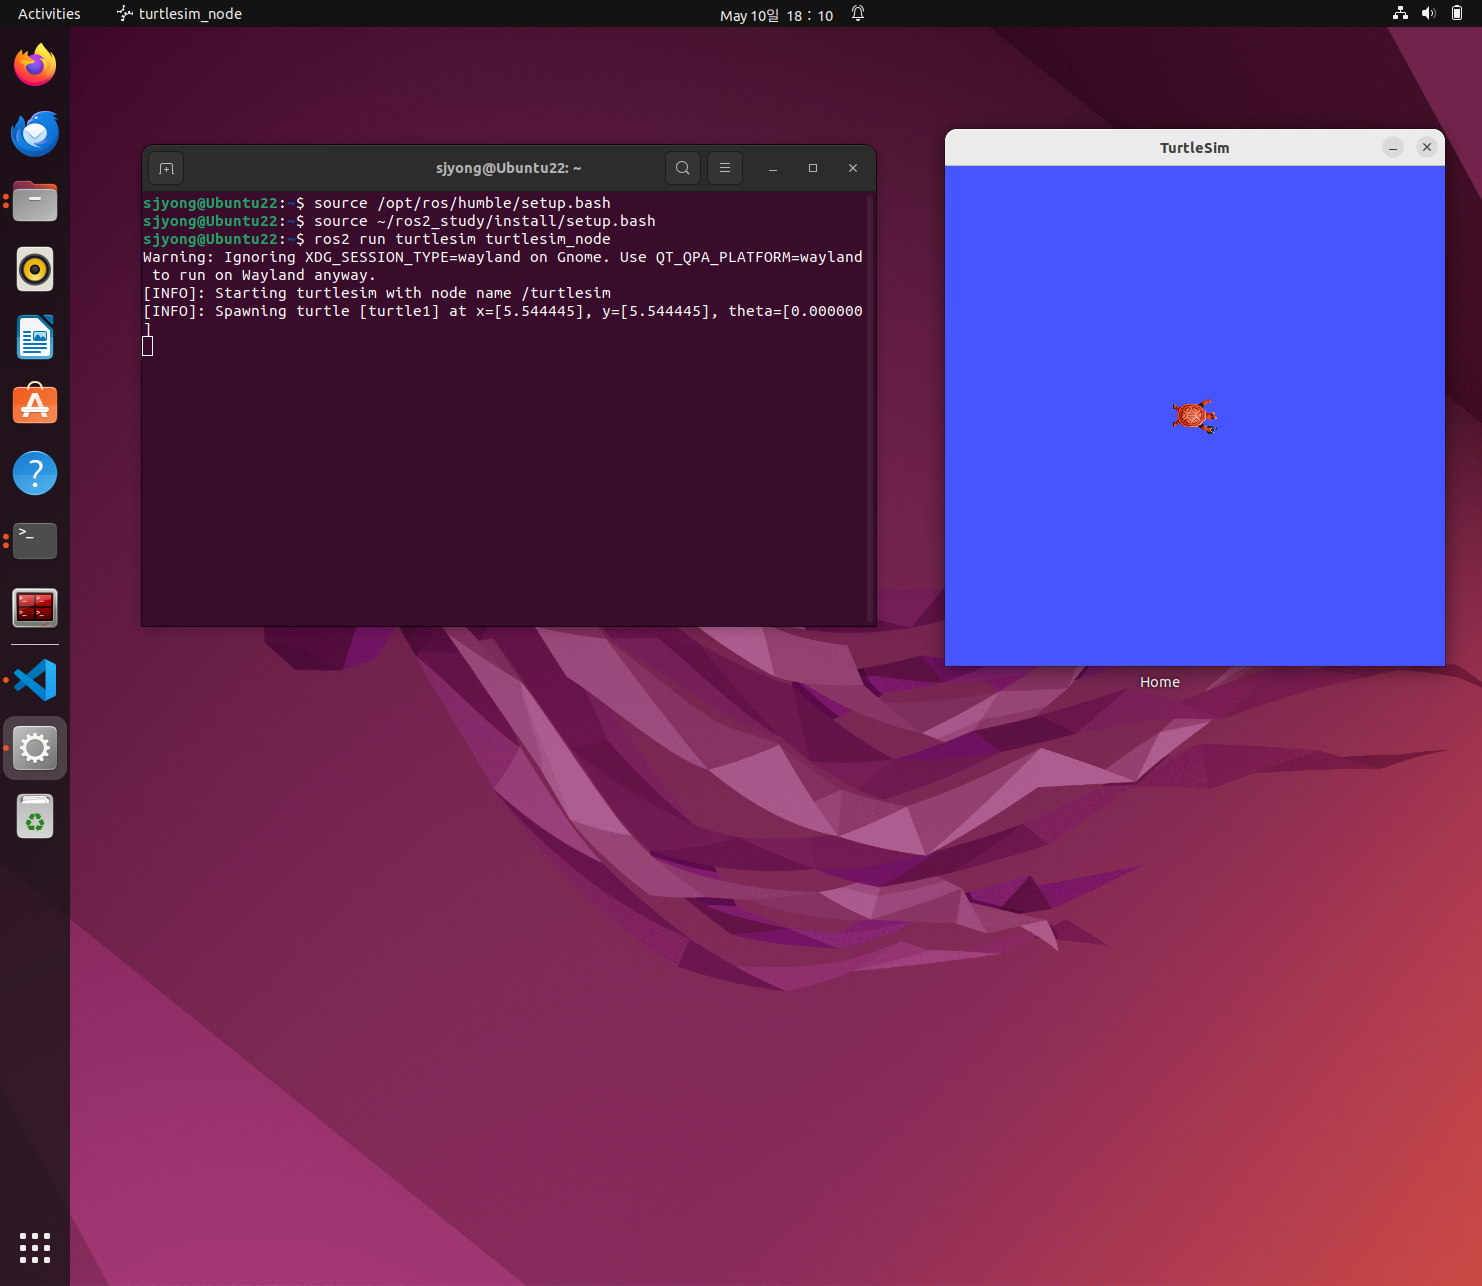
터미널 1: turtlesim 실행
ros2 run turtlesim turtlesim_node
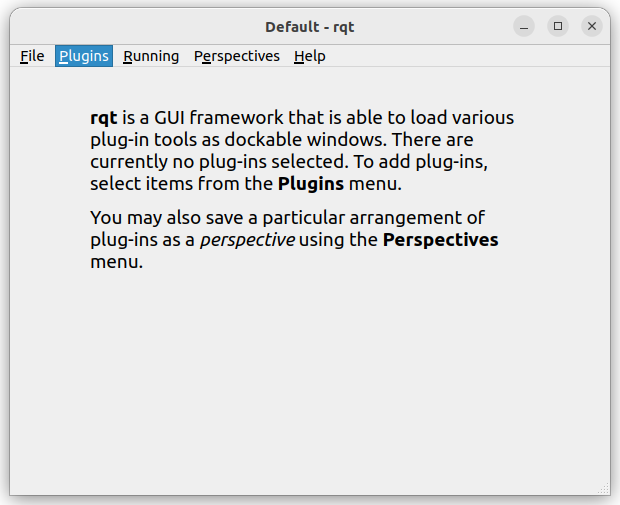
터미널 2: rqt 실행
rqt
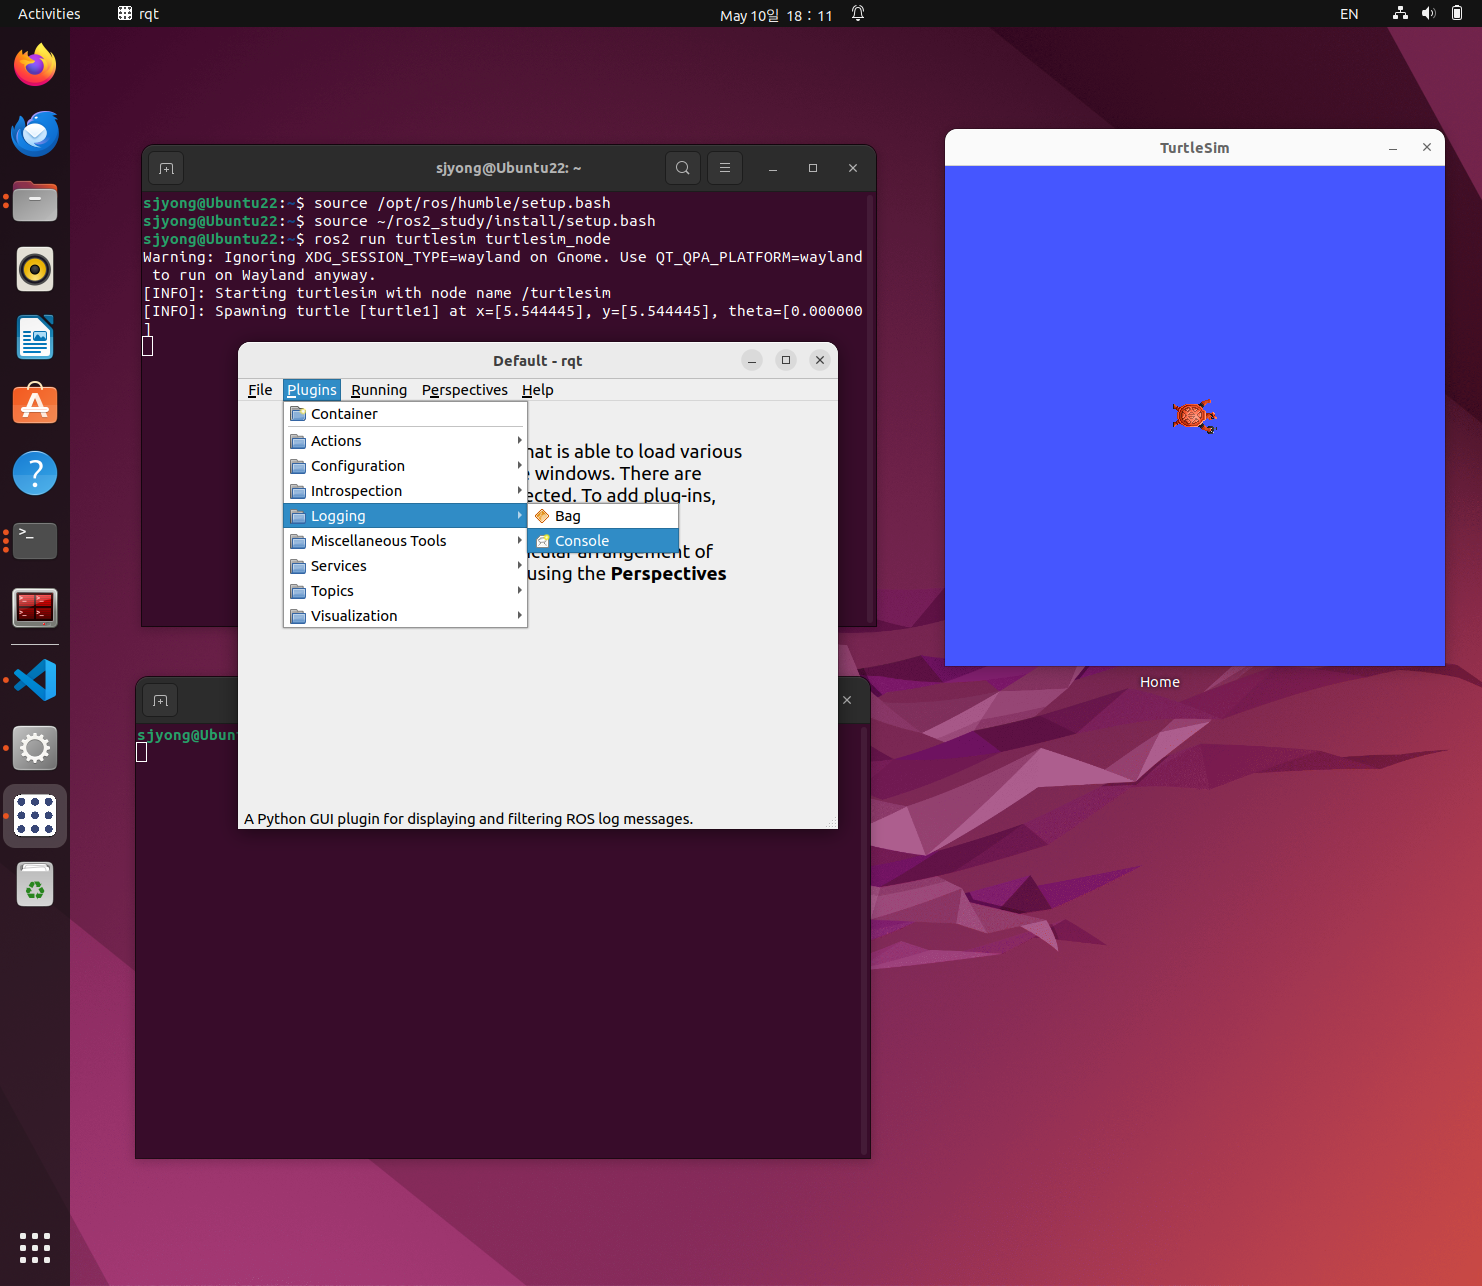
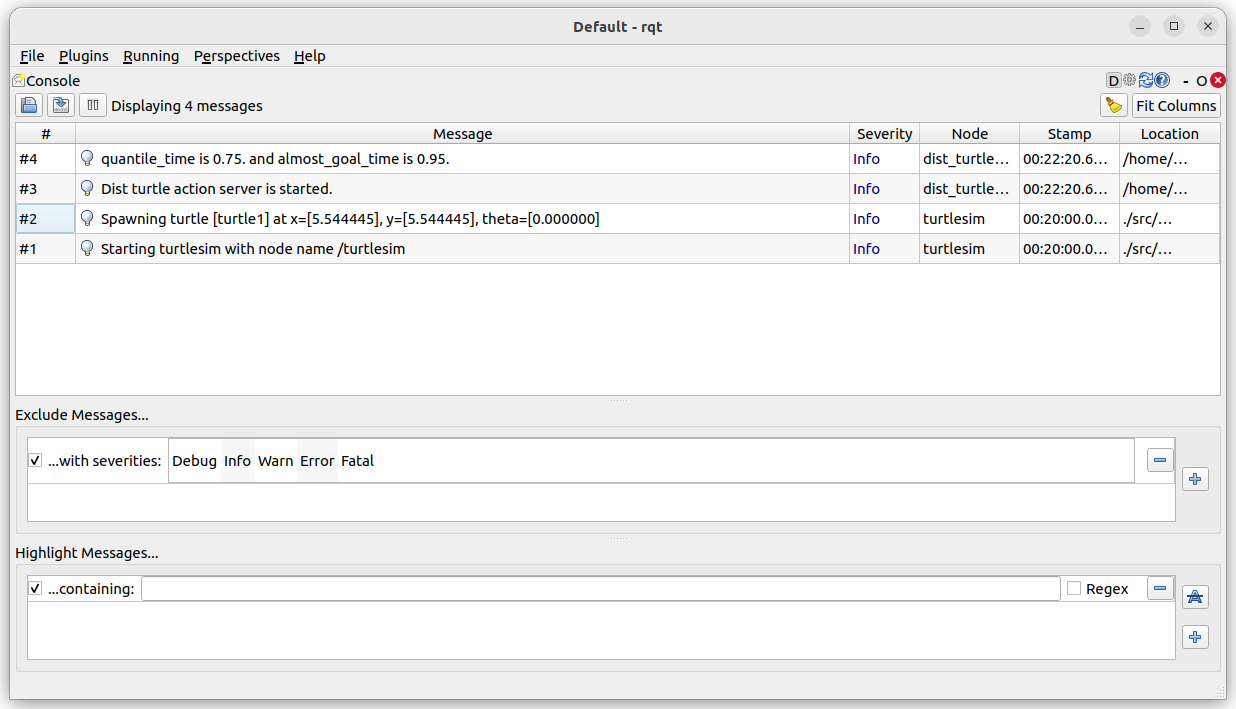
rqt를 실행하고 Plugins 메뉴에서 Logging의 Console을 선택합니다. 아래와 같은 logging console 창이 추력됩니다.
Plugins → Logging → Console
아래의 명령처럼 직접 실행도 가능합니다.
ros2 run rqt_console rqt_console
또는 환경에 따라 다음 명령도 사용할 수 있습니다.
rqt_console
터미널 3: turtle 이동 명령 발행
ros2 topic pub -r 1 /turtle1/cmd_vel geometry_msgs/msg/Twist "{linear: {x: 2.0, y: 0.0, z: 0.0}, angular: {x: 0.0, y: 0.0, z: 0.0}}"
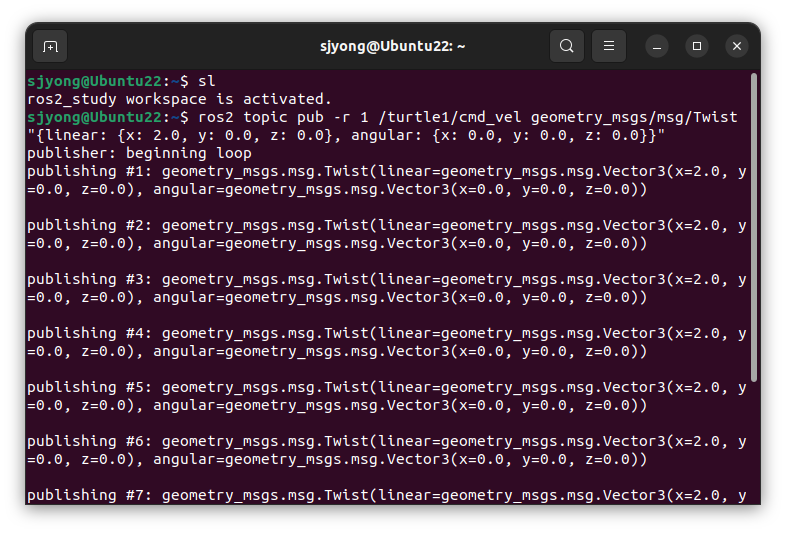
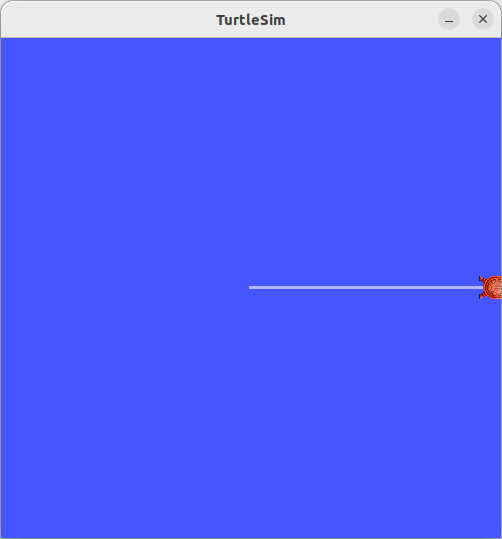
이 명령은 /turtle1/cmd_vel 토픽으로 Twist 메시지를 1초에 한 번씩 발행합니다.
turtlesim_node는 이 토픽을 구독하고 turtle을 전진시킵니다.
4. turtlesim 경고 로그 확인
turtle을 계속 직진시키면 벽에 부딪힙니다.
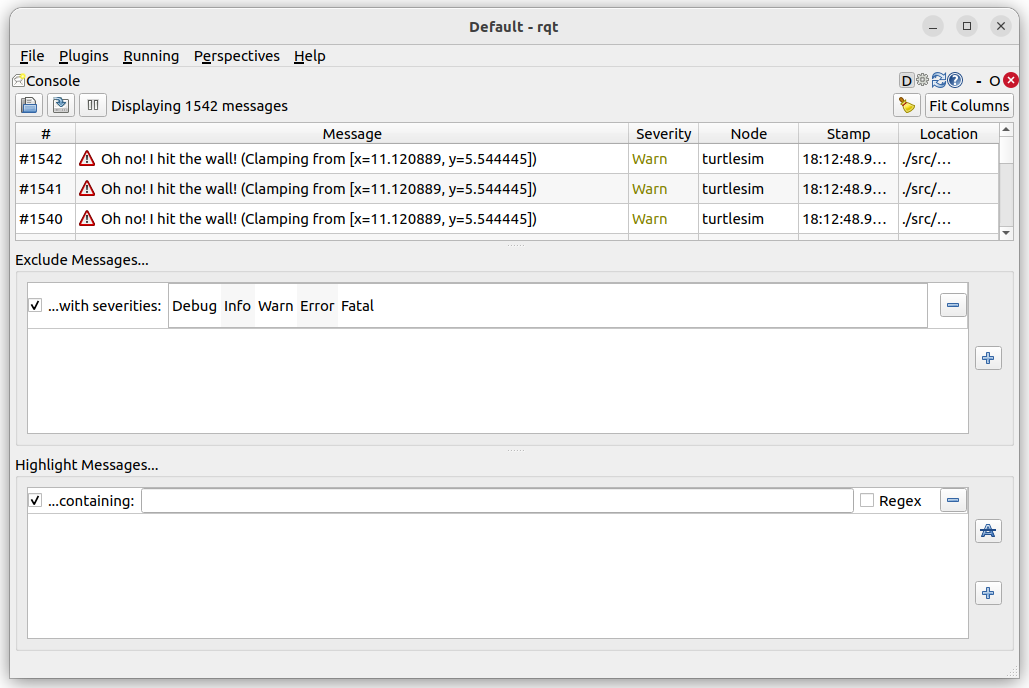
이때 turtlesim은 다음과 같은 경고 로그를 출력합니다.
[WARN] [turtlesim]: Oh no! I hit the wall! (Clamping from [x=..., y=...])
이 로그는 turtle이 시뮬레이션 공간의 경계에 도달했기 때문에 좌표가 제한되었다는 의미입니다.
rqt_console에서는 이 메시지를 표 형태로 확인할 수 있습니다.
확인 가능한 정보는 다음과 같습니다.
Message
Severity
Node
Stamp
Location
예를 들어 다음과 같이 표시됩니다.
Message: Oh no! I hit the wall!
Severity: Warn
Node: turtlesim
이 방식은 터미널 로그보다 훨씬 보기 편합니다.
특히 여러 노드가 동시에 실행되는 로봇 시스템에서는 특정 노드의 로그만 필터링할 수 있어 유용합니다.
5. ROS 2 로그의 필요성
초기 실습에서는 print()를 사용해 값을 확인할 수 있습니다. 하지만 실제 로봇 시스템에서는 print()만으로는 부족합니다.
ROS 2에서는 노드별로 로그를 남기는 기능을 제공합니다.
self.get_logger().info('Dist turtle action server is started.')
위 코드는 현재 노드에서 Info 수준의 로그를 출력합니다.
로그 수준은 보통 다음과 같이 구분합니다.
| Debug | 개발 중 상세 정보 확인 |
| Info | 일반적인 실행 상태 확인 |
| Warn | 경고 상황 |
| Error | 오류 발생 |
| Fatal | 시스템 중단이 필요한 심각한 문제 |
실무에서는 print()보다 self.get_logger() 사용을 권장합니다.
이유는 로그 수준 필터링, 노드 이름 표시, 시간 정보 확인, GUI 도구 연동이 가능하기 때문입니다.
6. 사용자 정의 Action Server에 로그 추가하기
수정할 소스 코드 파일은 다음입니다.
my_first_package/my_first_package/dist_turtle_action_server.py
init() 함수에 아래와 같이 직접 로그 메세지를 출력하는 문장을 추가합니다.
self.get_logger().info('Dist turtle action server is started.')
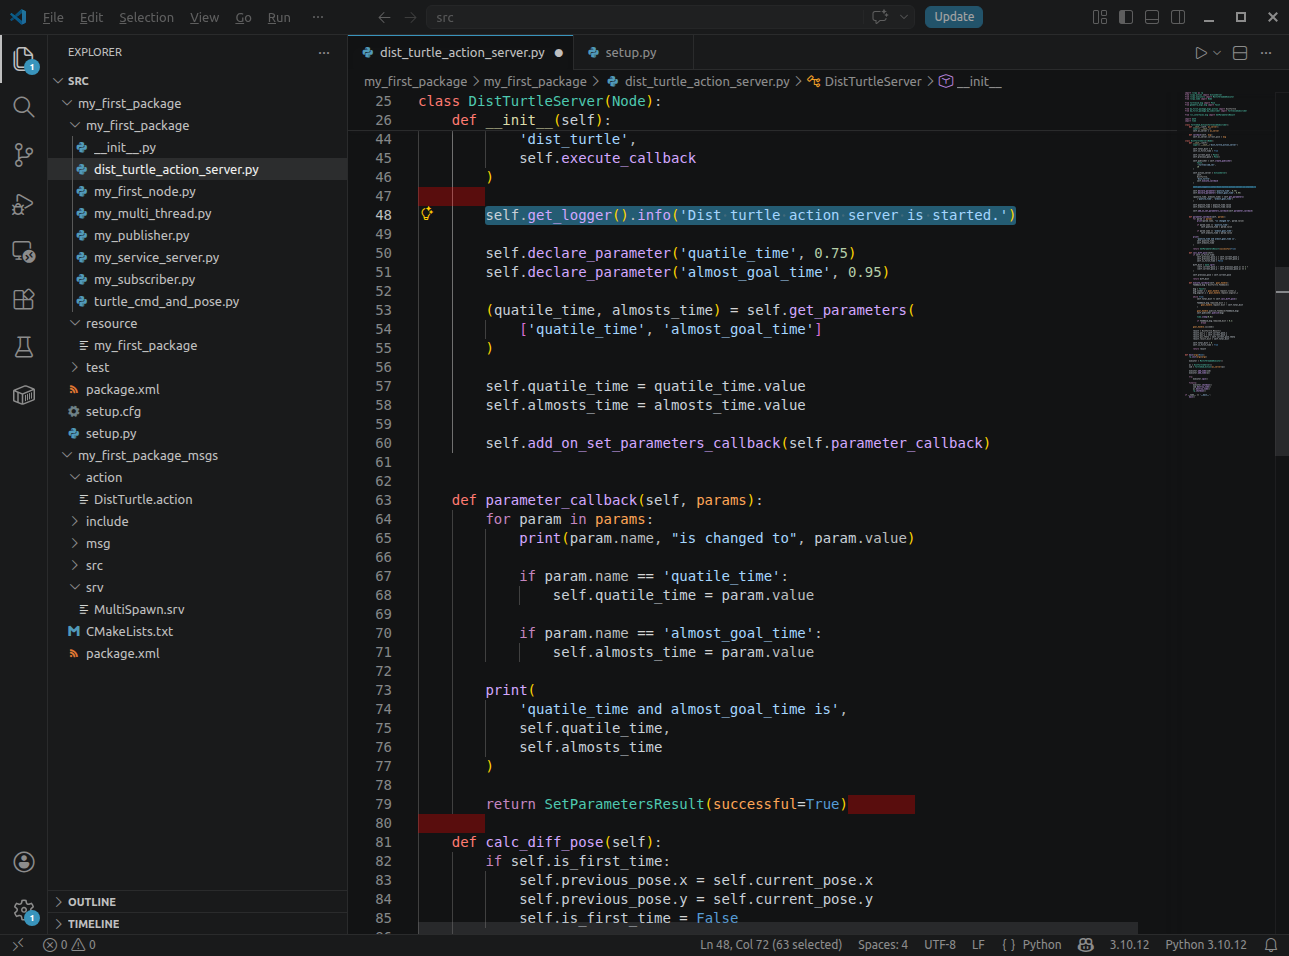
이 로그는 액션 서버가 정상적으로 시작되었는지 확인하기 위한 메시지입니다. 이 메세지는 터미널에도 출력되고 로그 기록에도 남게 됩니다.
수정 후에 워크스페이스에서 다시 빌드하고 "sl" 명령으로 환경을 다시 적용합니다.

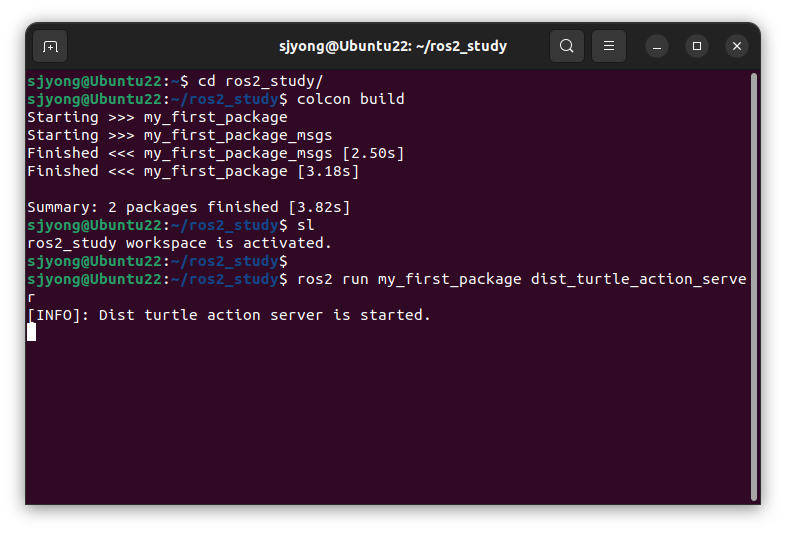
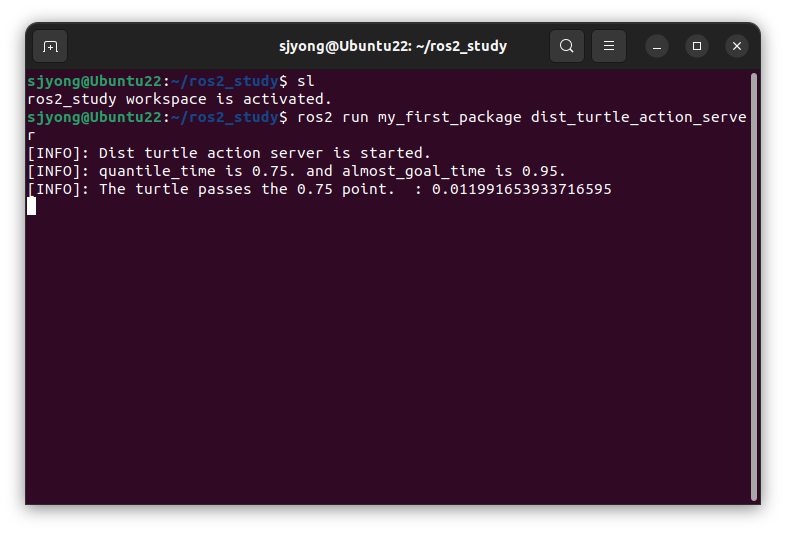
서버를 실행하면 아래와 같이 메세지가 출력됩니다.
7. 파라미터 선언과 초기 로그 출력
이전 실습에서 이미 소스 코드에는 두 개의 파라미터를 선언합니다.
self.declare_parameter('quantile_time', 0.75)
self.declare_parameter('almost_goal_time', 0.95)
의미는 다음과 같습니다.
| quantile_time | 목표 거리의 특정 비율 지점 |
| almost_goal_time | 목표에 거의 도달했다고 판단하는 비율 |
초기값을 읽은 뒤 로그로 출력합니다.
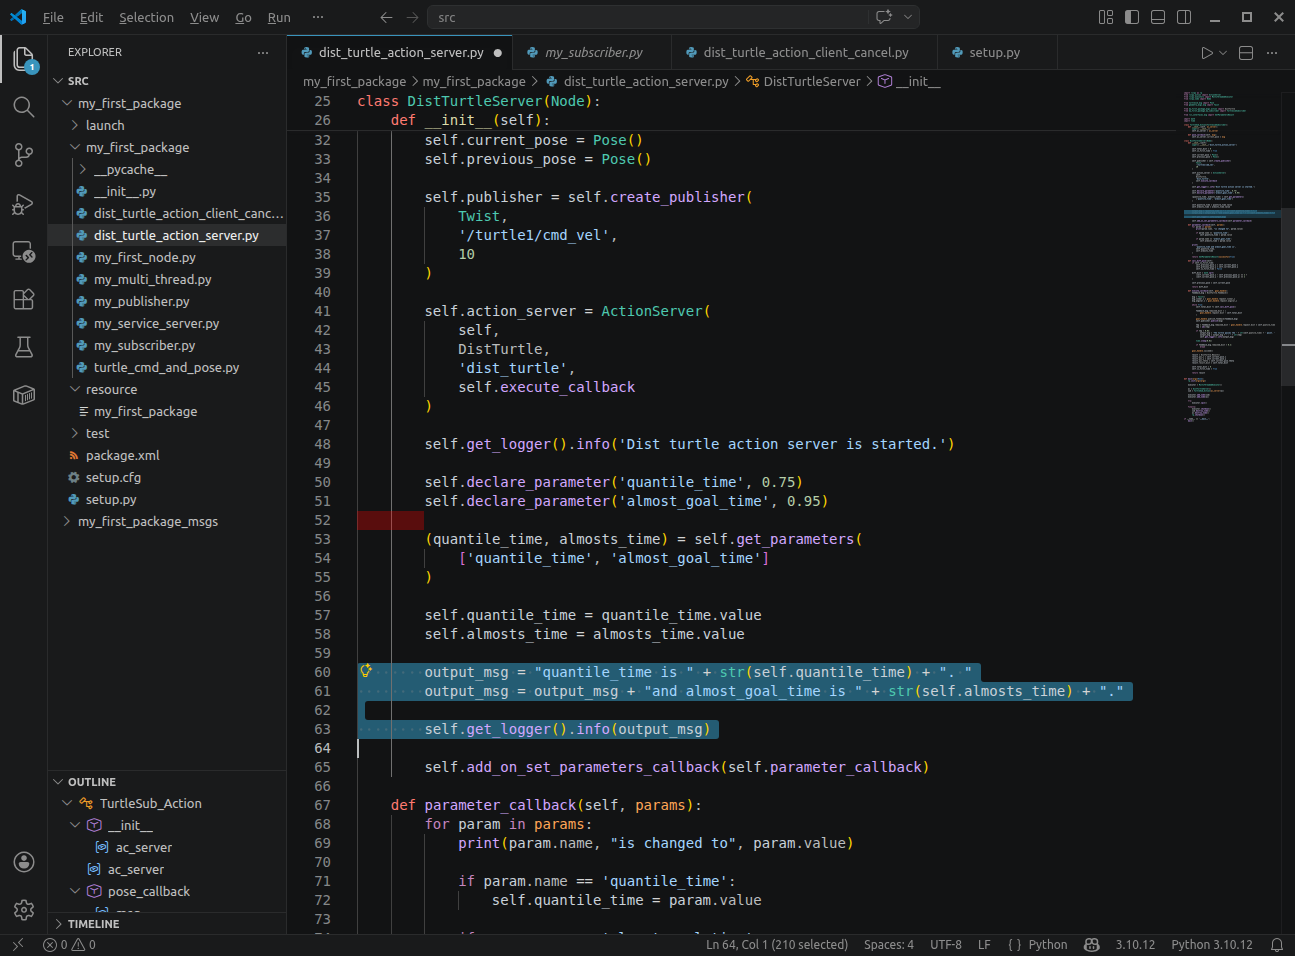
(quatile_time, almosts_time) = self.get_parameters(
    ['quantile_time', 'almost_goal_time']
)

self.quantile_time = quantile_time.value
self.almosts_time = almosts_time.value

output_msg = "quantile_time is " + str(self.quantile_time) + ". "
output_msg = output_msg + "and almost_goal_time is " + str(self.almosts_time) + "."

self.get_logger().info(output_msg)
위의 소스에서 저절한 위치를 찾아 아래 3줄을 추가합니다.
워크스페이스에서 다시 빌드를 수행하고 환경을 적용한 다음 액션 서버를 실행합니다.
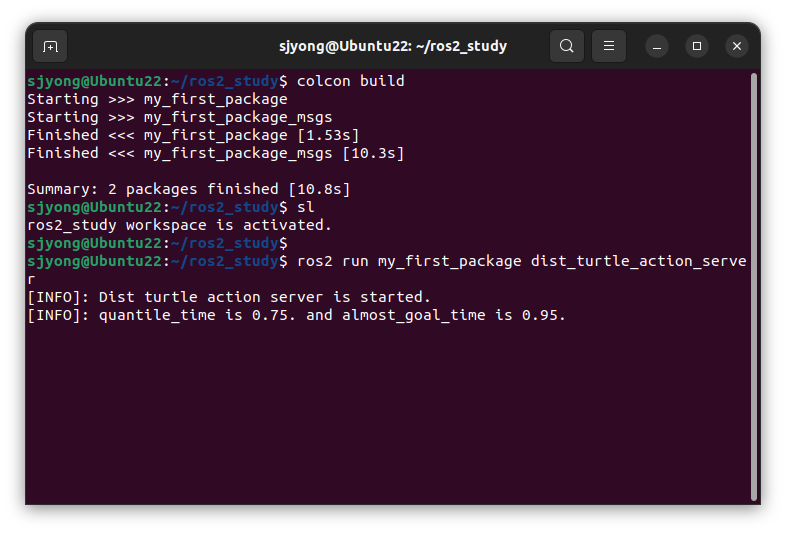
실행하면 액션 서버에서는 다음과 유사한 로그가 출력됩니다.
[INFO] [dist_turtle_action_server]: Dist turtle action server is started.
[INFO] [dist_turtle_action_server]: quantile_time is 0.75. and almost_goal_time is 0.95.
8. 파라미터 변경 콜백
ROS 2에서는 실행 중에도 파라미터 값을 변경할 수 있습니다.
이때 특정 함수가 호출되도록 콜백을 등록할 수 있습니다.
self.add_on_set_parameters_callback(self.parameter_callback)
콜백 함수 구조는 다음과 같습니다.
def parameter_callback(self, params):
        for param in params:
            print(param.name, "is changed to", param.value)

            if param.name == 'quantile_time':
                self.quantile_time = param.value

            if param.name == 'almost_goal_time':
                self.almosts_time = param.value

        print(
            'quatile_time and almost_goal_time is',
            self.quantile_time,
            self.almosts_time
        )

        return SetParametersResult(successful=True)
블로그용으로는 print()보다 다음처럼 로그로 바꾸는 구성이 더 좋습니다.
self.get_logger().info(
    f"{param.name} is changed to {param.value}"
)
개선하면 다음과 같습니다.
def parameter_callback(self, params):
    for param in params:
        self.get_logger().info(
            f"Parameter changed: {param.name} = {param.value}"
        )

        if param.name == 'quantile_time':
            self.quantile_time = param.value

        elif param.name == 'almost_goal_time':
            self.almosts_time = param.value

    self.get_logger().info(
        f"Current parameters: quantile_time={self.quantile_time}, "
        f"almost_goal_time={self.almosts_time}"
    )

    return SetParametersResult(successful=True)
이렇게 하면 로그 관리가 더 깔끔해집니다.

9. Action Server 실행 콜백 수정
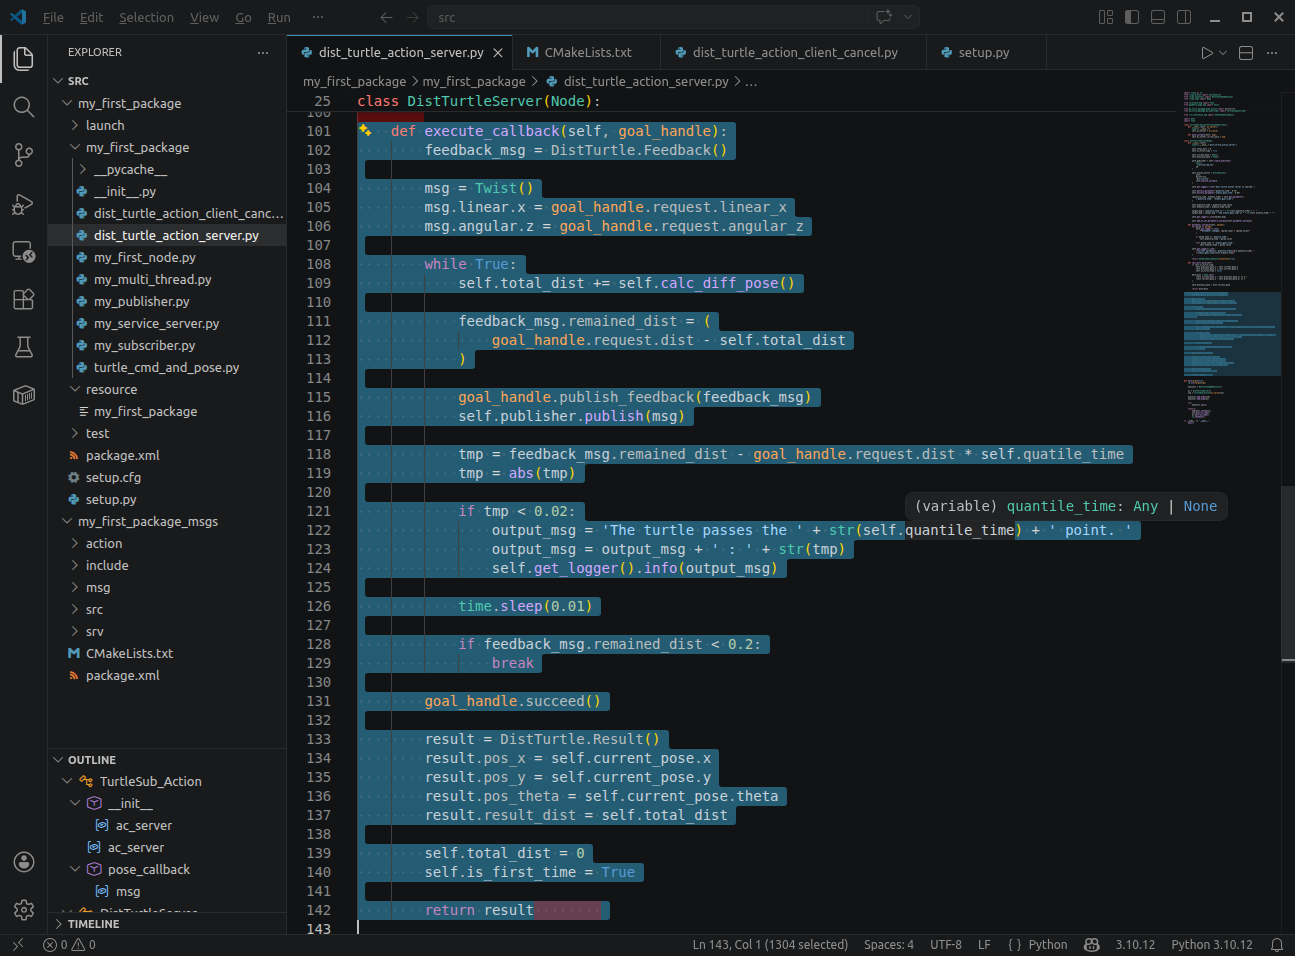
아래와 같이 남은 거리가 0.02보다 작은 값일 때 로그를 남기도록 execute_callback() 함수의 내용을 수정합니다.
def execute_callback(self, goal_handle):
    feedback_msg = DistTurtle.Feedback()

    msg = Twist()
    msg.linear.x = goal_handle.request.linear_x
    msg.angular.z = goal_handle.request.angular_z

    while True:
        self.total_dist += self.calc_diff_pose()

        feedback_msg.remained_dist = (
            goal_handle.request.dist - self.total_dist
        )

        goal_handle.publish_feedback(feedback_msg)
        self.publisher.publish(msg)

        tmp = feedback_msg.remained_dist - goal_handle.request.dist * self.quantile_time
        tmp = abs(tmp)

        if tmp < 0.02:
            output_msg = 'The turtle passes the ' + str(self.quantile_time) + ' point. '
            output_msg = output_msg + ' : ' + str(tmp)
            self.get_logger().info(output_msg)

        time.sleep(0.01)

        if feedback_msg.remained_dist < 0.2:
            break

    goal_handle.succeed()

    result = DistTurtle.Result()
    result.pos_x = self.current_pose.x
    result.pos_y = self.current_pose.y
    result.pos_theta = self.current_pose.theta
    result.result_dist = self.total_dist

    self.total_dist = 0
    self.is_first_time = True

    return result
이 코드의 동작 흐름은 다음과 같습니다.
1. 액션 목표값을 받습니다.
2. linear_x, angular_z 값을 Twist 메시지에 저장합니다.
3. turtle을 움직입니다.
4. 현재 위치와 이전 위치 차이로 이동 거리를 계산합니다.
5. 목표 거리까지 남은 거리를 feedback으로 보냅니다.
6. 특정 지점에 도달하면 로그를 출력합니다.
7. 목표에 가까워지면 액션을 성공 처리합니다.
8. 최종 위치와 이동 거리를 result로 반환합니다.
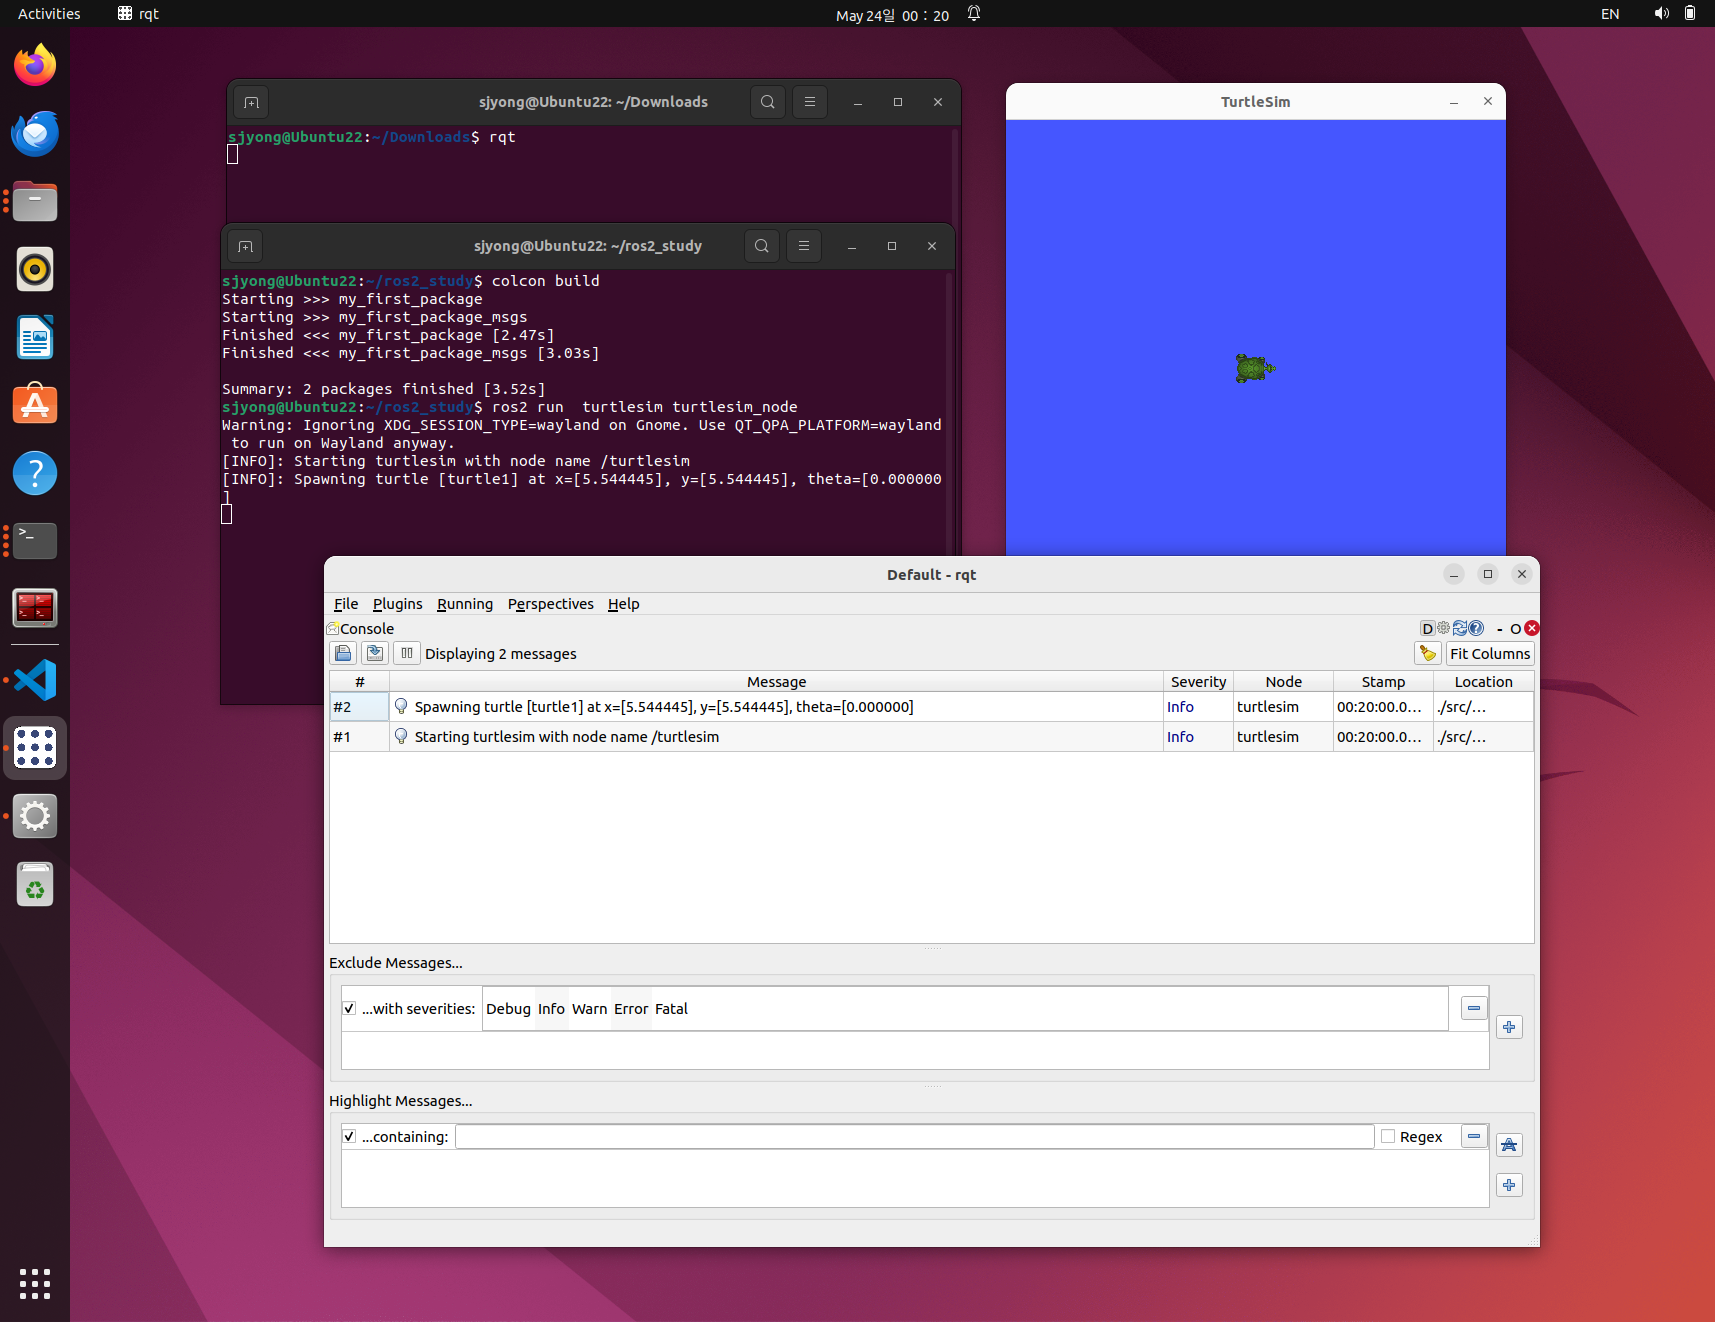
10. 로그 수정 내용 실행
워크스페이스를 다시 빌드하고 환경을 적용합니다.
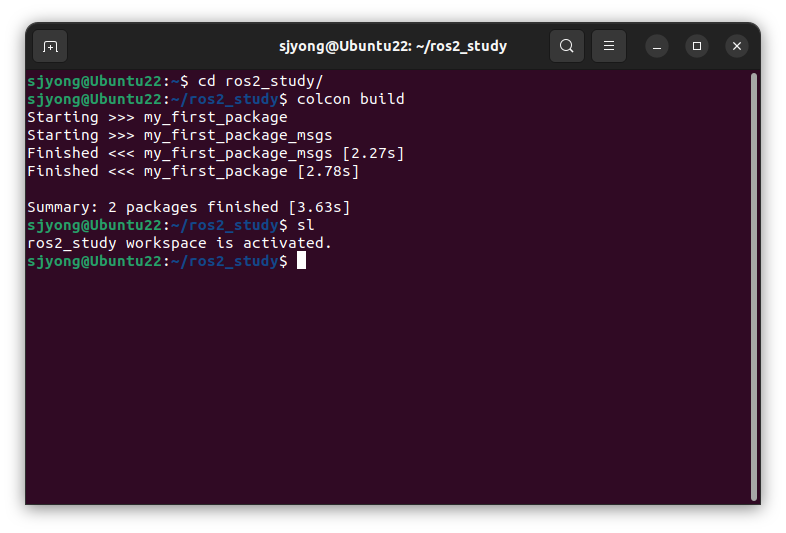
먼저 rqt를 실행합니다.
rqt
rqt를 실행한 뒤 메뉴에서 선택할 수도 있습니다.
Plugins → Introspection → Node Graph
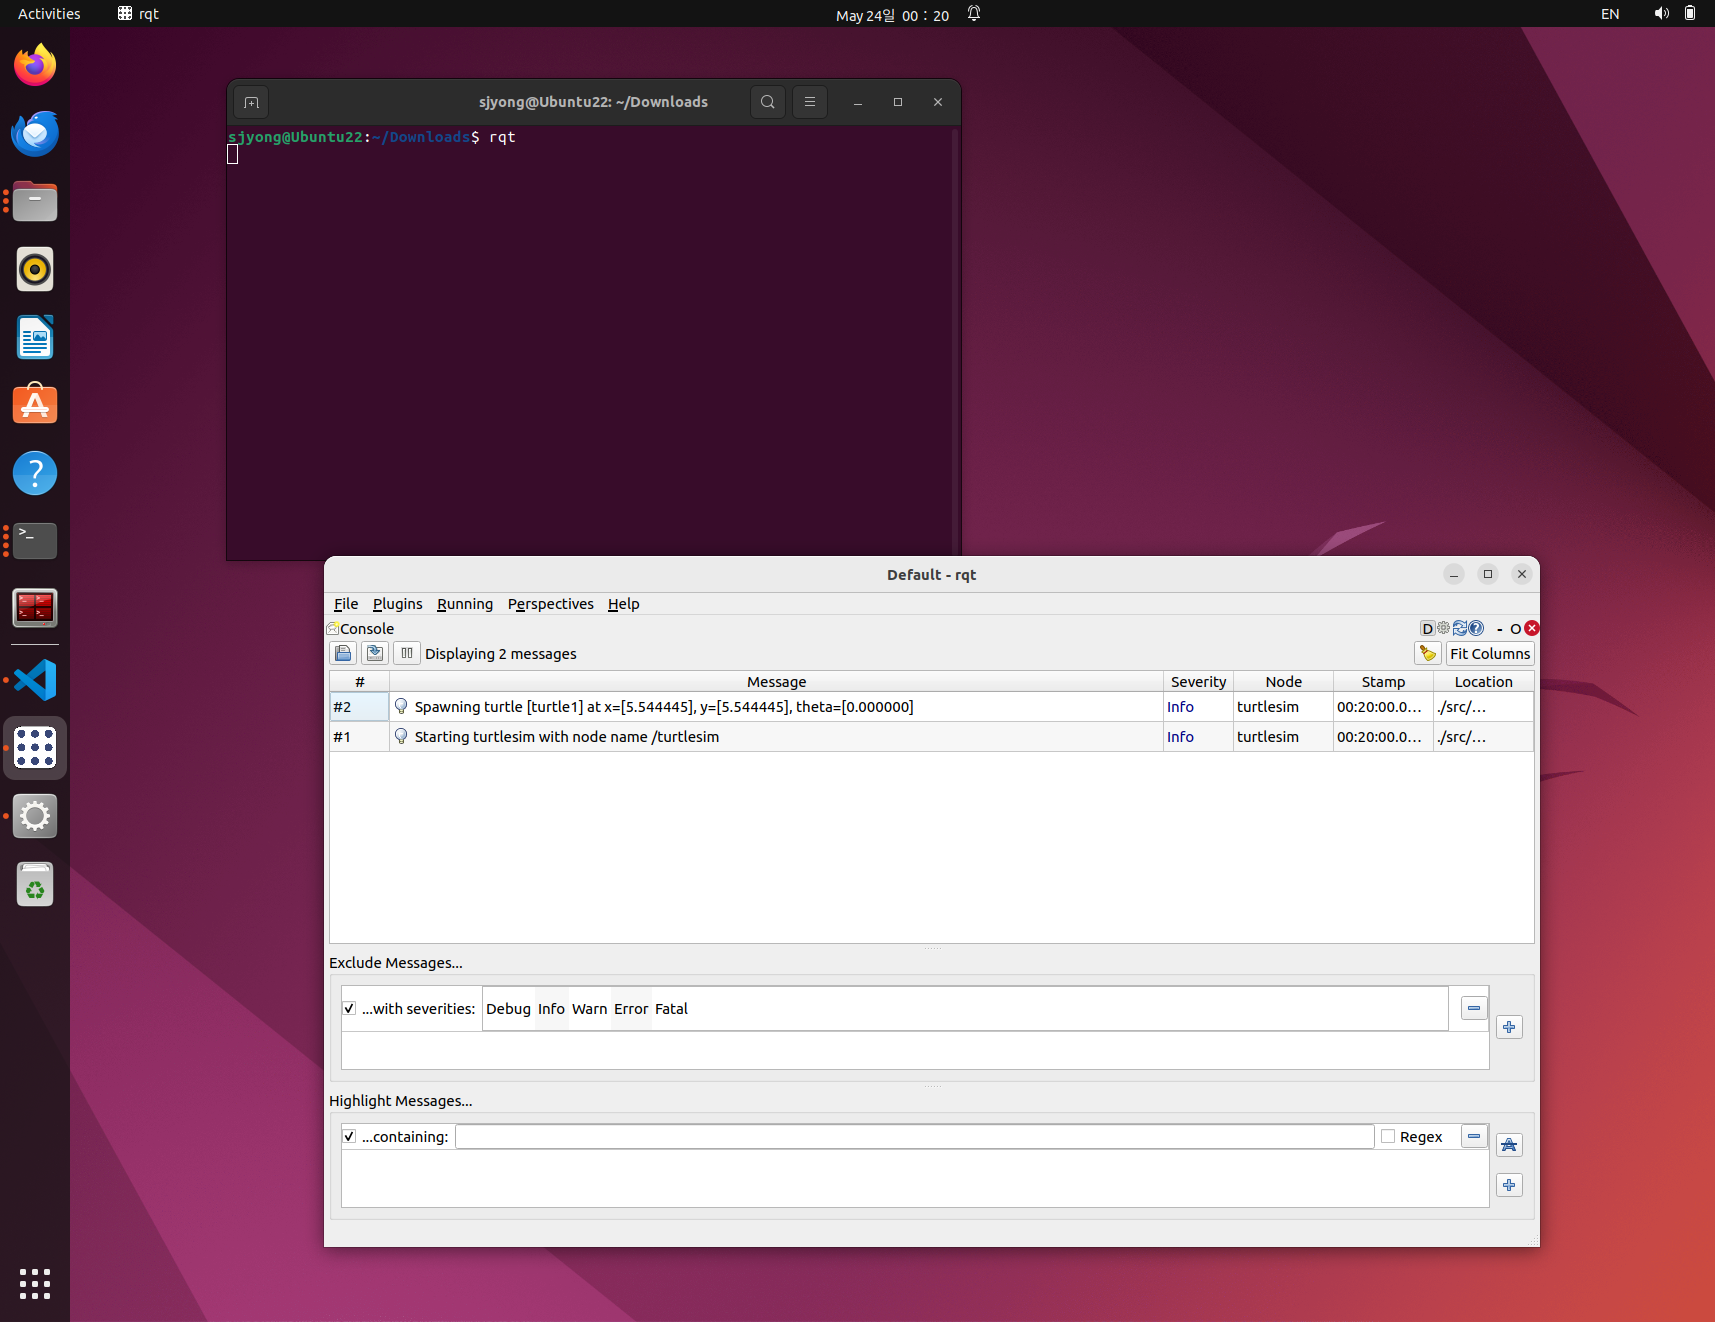
다음은 turtlesim_node를 실행합니다.
그리고 액션 서버를 실행합니다.
ros2 run my_first_package dist_turtle_action_server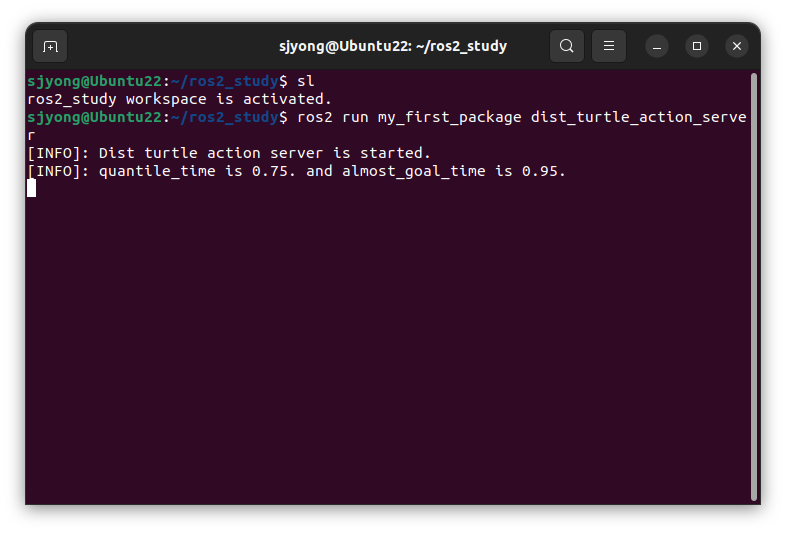
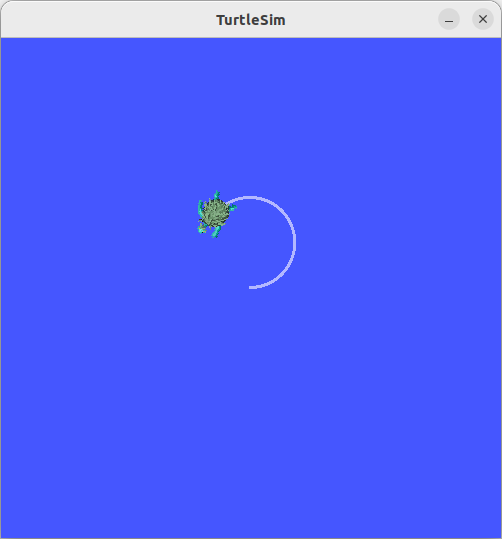
다른 터미널에서 아래와 같이 액션 목표 전송 명령을 실행합니다.
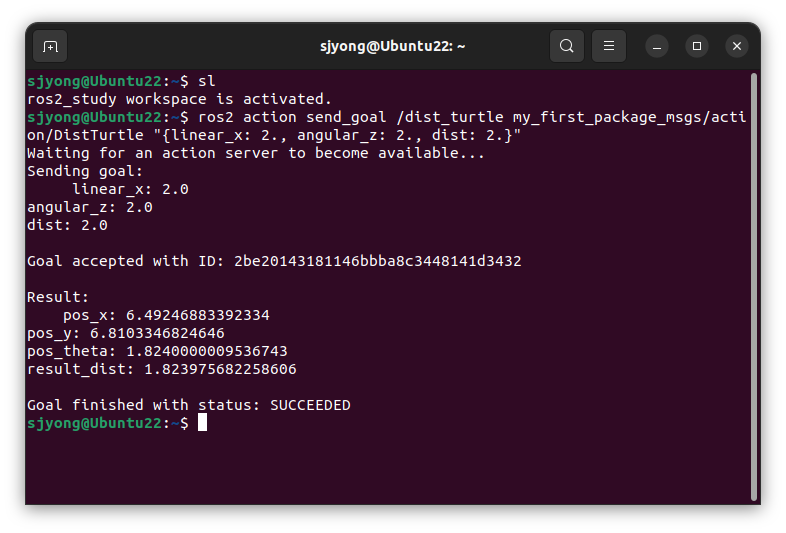
os2 action send_goal /dist_turtle my_first_package_msgs/action/DistTurtle "{linear_x: 2., angular_z: 2., dist: 2.}"
이 명령은 /dist_turtle 액션 서버에 목표값을 보냅니다.
각 필드의 의미는 다음과 같습니다.
| linear_x | 전진 속도 |
| angular_z | 회전 속도 |
| dist | 목표 이동 거리 |
실행 결과는 다음과 비슷하게 나옵니다.
Waiting for an action server to become available...
Sending goal:
  linear_x: 2.0
  angular_z: 2.0
  dist: 2.0

Goal accepted with ID: ...
Result:
  pos_x: ...
  pos_y: ...
  pos_theta: ...
  result_dist: ...

Goal finished with status: SUCCEEDED

ROS 2를 처음 배울 때는 print()가 편합니다.
하지만 노드가 많아지고 터미널이 여러 개가 되면 print()는 관리가 어렵습니다.
예를 들어 다음 코드는 단순 출력입니다.
print("server started")
반면 ROS 2 logger는 노드 이름과 로그 레벨을 포함합니다.
self.get_logger().info("server started")
출력은 다음처럼 표시됩니다.
[INFO] [dist_turtle_action_server]: server started
이 차이는 작아 보이지만, 실제 로봇 시스템에서는 매우 큽니다.
특히 다음 상황에서는 logger가 필수입니다.
여러 노드가 동시에 실행될 때
특정 노드의 로그만 보고 싶을 때
Warn/Error 로그만 필터링하고 싶을 때
rqt_console로 GUI 확인을 하고 싶을 때
rosbag 또는 시스템 로그와 함께 분석할 때